The problem setting is as follows: 48.15 milligrams of a drug D is given by mouth, and blood concentrations of the drug D and also of its only metabolite M are measured. Also the cumulative amounts of D and M in the urine are measured. Thus, we have the following data.
Note: In the data table below, blanks represent missing data. In order to prepare the data for input, some value must be supplied at each place where a number is missing. Any unique value may be used for these missing values since we will remove them later. For this example, zero will be entered for the missing table values.
time      blood-D         blood-M        urine-D   urine-M
(hours)  (mg/liter)     (mg/liter)        (mg)     (mg)
===========================================================
.82       .1746           .822051          -         -
1         -               -                1.87      7.23
1.2       .166            .143786          -         -
1.4       .1264           .152462          -         -
2         .1092           .859647          3.23      15.53
2.4       .0904           .648531          -         -
2.9       .0828           .601536          -         -
3         -                -               4.02      21.15
3.38      .0704           .381744          -         -
3.92      .0591           .402711          -         -
4         -               -                4.59      25.88
4.42      .0511           .30366           -         -
5.18      .0355           .252327          -         -
6         -               -                5.77      32.42
6.35      .0148           .143154          -         -
8         -               -                6.3       34.89
8.3       .0081           .063624          -         -
10        -               -                6.51      36.16
10.28     .0047           .033258          -         -
12        -               -                6.65      37.06
12.4      .0026           .020967          -         -
24        -               -                6.92      38.7
24.57     .0009           .006507          -         -
48        -               -                7.3       40.29
72        -               -                7.38      40.77
We wish to devise a model for the uptake, metabolic conversion and excretion of this drug, and curve-fit to adjust the model to fit the observed data.
The error in the blood concentration measurements has a variance which is roughly proportional to the square of the true measurement value. The error in the urine amounts has a more-rearly constant variance. Whatever model we use to predict D(t) (blood drug concentration at time t), M(t) (blood metabolite concentration at time t), A(t) (urine drug amount at time t), and B(t) (urine metabolite amount at time t), we will want to weight our observations by weights which are proportional to the reciprocals of the variances.
We will use the MLAB EWT operator which employs the deviations from a smoothed spline to estimate the errors in data values. Using EWT on the various data sets produces error estimates scaled comparably to the underlying error of the data sets themselves. This has the effect that the deviations will each be approximately sized so that each of our sets of observed data is given more or less correct weight in the sum of squares to be minimized.
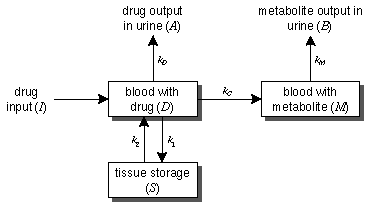
As a model, let us consider the following compartmental form.
This is a highly simplified model; the path from the blood drug compartment to the blood metabolite compartment should probably include a metabolic conversion compartment, and perhaps the metabolite should go in and out of tissue as does the drug D, but this model is already near the limit of what we can usefully fit to the data.
Let VB be the volume in
liters of the blood and let VS be the volume in liters of the tissue of the subject
being studied. We let VM
denote the volume in liters of the blood-metabolite compartment; we
would expect that VM =
VB, but we may obtain a better
fit when this constraint is not honored.
Let D(t) = the concentration of the drug D in the blood
at the time t, let M(t) be the concentration of the
metabolite M in the blood at time t, let S(t) be
the concentration of the drug D in the tissue at time t.
Also, let A(t) be the cumulative amount of drug D which
has appeared in the urine by time t, and let B(t) be the
cumulative amount of the metabolite M which has appeared in the
urine by time t.
We can write the following model involving a first-order ordinary
differential equation for each compartment.
The choice of the input function, I, is somewhat arbitrary.
However, if the drug is absorbed as fast as it passes at a constant
rate into the small intestine, we may choose I(t) = if
t < ET then
48.15/ET else 0, so 48.15
mg. of the drug is introduced at a constant rate over ET hours.
We could instead use the form I(t) = 48.15 * t * H *
exp(-H*t), and introduce the constraint H > 0.
It turns out this makes little difference in the final results.
Note that kM,
kC, k1 and k2 are in units of liters/hour, the derivatives D',
S', and M' are in units of mg/liter/hour, A' and
B' are in units of mg/hour, D, S, and M
are in units of mg/liter, A and B are in units of mg,
VB, VS and VM are in units of liters, and I(t) is in units of
mg/hour, and these units are dimensionally consistent.
It is necessary to use constraints for fitting this model; without
them, the parameters may well be assigned foolish values where the
differential equations cannot be integrated numerically. Let us
assume the following constraints.
{.1 < ET < 70, 0 <
k1, 0 < k2, 0 < kD,
0 < kC, 0 < kM, 3 < VB
< 7, 10 < VS < 100
VM > .01}
Now we need initial guesses for all the parameters. These guesses
must be suitable; arbitrary guesses can lead to unreasonable final fit
values, or even cause the fitting process to be unable to proceed due
to excessive stiffness of the differential equations!
Suppose a unit amount of drug diffuses from blood into tissue so that
half of it is transfered in one hour. Then if y is the amount of drug
in the blood, we have y' = -k1y with y(0)= 1, and y(1) = .5, and so
k1 approx .7. Let us also guess
that k2 =.7.
If half of a unit amount of drug is cleared from the blood and
transferred to the urine by the kidneys in about 4 hours, then
kD approx .17. Let us also guess
that kM =.17. Similarly,
let us guess kC = .17.
Finally we choose VB = 5,
VM = 5, VS = 40, and ET = 1.
Now we may proceed in MLAB as follows. First we enter the data listed
above, with zeros for missing values, and then we construct the
corresponding weight vectors WD, WM, WA, and WB.
Note that we must beware of assuming that our obtained parameters have
any physical significance. It is unlikely, for example, that the
actual compartment volumes are close to the values we have for
VB, VM and VS. Our model may be
useful for prediction purposes, but it is not useful for
gaining insight into any actual physiological mechanisms.
D' = (I(t) - (k1+kD+kC)D + k2*S)/V_B
S' = (k1*D - k2*S)/VS
M' = (kC*D - kM*M)/VM
A' = kD*D
B' = kM*M
with D(0) = 0, M(0) = 0, S(0) = 0, A(0) =
0, and B(0) = 0.
n = read(dataf, 100, 5)
tv = n col 1;  "tv = time values"
dv = n col 2;  "dv = blood drug data."
mv = n col 3;	 "mv = blood metabolite data."
av = n col 4;	 "av = urine drug data."
bv = n col 5;	 "bv = urine metabolite data."

dv = tv &' dv;  dv = compress(dv,2); wd =ewt(dv)
mv = tv &' mv;  mv = compress(mv,2); wm =ewt(mv)
av = tv &' av;  av = compress(av,2); wa =ewt(av)
bv = tv &' bv;  bv = compress(bv,2); wb =ewt(bv)
Now we enter our model, our constraints, and our inital guesses.
function d't(t) = (i(t) - (k1 + kd + kc)*d + k2*s)/vb
function s't(t) = (k1*d - k2*s)/vs
function m't(t) = (kc*d - km*m)/vm
function a't(t) = kd*d
function b't(t) = km*m
function i(t) = if t<et then dose/et else 0

initial d(0) = d0
initial s(0) = 0
initial m(0) = 0
initial a(0) = 0
initial b(0) = 0

d0 = 0; dose = 48.15

k1=.7;k2=k1;kd=.17;km=kd;kc=kd;vb=5;vs=40;et=1;vm=5

constraints c = {k1>0, k2>0, kc>0, km>0, et>.1, et<70, vb>3, \
: vb<7, vs>10, vs<100, vm>.01}
Now we proceed to fit. Due to the large amount of
time needed to fit this stiff model, we use Gear's method with a
tolerance of .01.
method = gear;
maxiter = 100
errfac = 0.01

fit(k1,k2,kc,kd,km,et,vb,vs,vm), \
: d to dv with weight wd, m to mv with weight wm, \
: a to av with weight wa, b to bv with weight wb, constraints c

final parameter values
      value               error                dependency    parameter
    19.55670378         12.41128315          0.7277144348   K1
    4.829029615         56.05648908          0.9970952774   K2
    95.71231349         18.05875113          0.9611351847   KC
    17.29009355         3.174400652          0.9601255658   KD
    13.57478156         2.526143866          0.6637941471   KM
    4.835844445        0.8222361079           0.945128974   ET
    4.168221663          13.3558721          0.5651377681   VB
      88.309337         930.8309603           0.997317646   VS
    3.929260682         8.161760496          0.9041479451   VM
22 iterations
CONVERGED
best weighted sum of squares = 3.054944e+02
weighted root mean square error = 2.665431e+00
weighted deviation fraction = 5.505088e-02
R squared = 9.959130e-01
no active constraints
Now we will graph our four data sets together with the best-fit curves
produced by solving our system of differential equations with the
parameter values obtained above.
tv=0:75!120
draw points(d,tv) color brown
draw dv color red pt xpt lt none
image color white
top title " Drug concentration in Blood" font 11 size .03
left title "'-90AD" font 11 size .03
bottom title "time"
frame 0 to .5, 0 to .5
w1=w

draw points(m,tv) color blue
draw mv color blue pt octagon lt none
image color yellow; frame color green
top title "Metabolite concentration in Blood" font 11 color brown size .03
left title "'-90AM" font 11 size .03
bottom title "time"
frame .5 to 1, 0 to .5
w2=w

draw points(a,tv) color purple
draw av color red pt square lt none
image color grey; frame color brown
top title " Drug amount in Urine" font 11 size .03
left title "'-90AA" font 11 size .03
bottom title "time"
frame 0 to .5, .5 to 1
w3=w

draw points(b,tv) color brown
draw bv color blue pt crosspt lt none
image color aqua; frame color red
top title " Metabolite amount in Urine" font 11 size .03
left title "-90AB" font 11 size .03
bottom title "time"
window 0 to 80, 0 to 45
frame .5 to 1, .5 to 1
w4=w

view
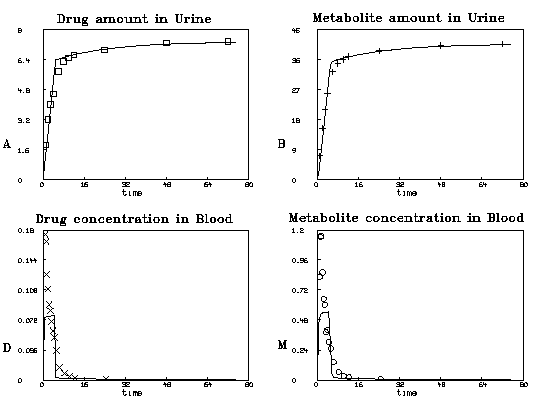
This is not the only reasonable fit. Starting from other guesses, for
example: K1=223, K2=14.7, KC=66, KD=11.7, KM=9.7, ET=1.95, VB=6.24,
VS=12.35, and VM=0.04, we can obtain other, quite different,
results. The large dependency values of the parameters indicate that
this problem does not have a unique answer. Probably the problem is
over-parameterized.
k1 = 223; k2 = 14.7
kd = 11.7; km = 9.7; kc = 66
vb = 6.24; vs = 12.35; vm =.04; et = 1.95;

fit(k1,k2,kc,kd,km,et,vb,vs,vm), \
: d to dv with weight wd, m to mv with weight wm, \
: a to av with weight wa, b to bv with weight wb, constraints c

final parameter values
      value               error                dependency    parameter
    222.3296966         27.76132266          0.8337053755   K1
     14.7359648         3117.341849          0.9999999383   K2
    65.98333895         3.836887237          0.9399933157   KC
     11.7407663         0.692533352           0.938315949   KD
    9.697523939        0.6754487655          0.6928345824   KM
    1.960006851         0.059767016          0.9654962599   ET
    5.964737228         3.990424231           0.866044195   VB
    12.31946483         2605.653695          0.9999999384   VS
  0.04208395842       0.01012174536          0.9703620604   VM
3 iterations
CONVERGED
best weighted sum of squares = 4.491649e+01
weighted root mean square error = 1.022042e+00
weighted deviation fraction = 2.993774e-02
R squared = 9.941458e-01
no active constraints
The graphical results of this fit are shown below. Note we fit the
blood-drug and blood-metabolite concentrations more closely at the
expense of urine-drug and urine-metabolite fitting.
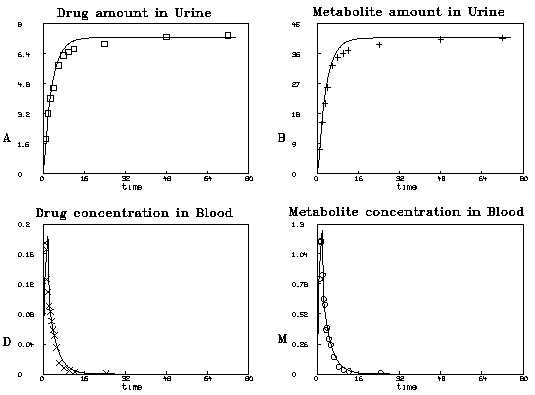
The existence of multiple local minima corresponding to different parameter values is further indication that our model is not physically accurate. Thus, we should choose our parameter values so that the four curves are adequately predicted without concern for the physical meanings of the parameters.
![[Back to CSI Home Page]](http:/Images/Home.gif)