Gary D. Knott, Ph.D.
This example shows how to solve a statistical simulation and display
problem. Imagine that telephone calls arrive at a bank of n ports
and each call is assigned to the first open port found by scanning, in
order, ports 1, 2, .... We assume n is large enough so that no
call will be denied a port. Suppose that the length of the ith call,
li, follows a lognormal distribution, so that, for all i, the
length, li, of the ith call has the probability density function
|
|
The average length of a call is then m·exp(s2/2), and we will choose m = 10 and s = .5. The call lengths l1, l2, ... are all independent. Also, suppose calls arrive at varying times with exponentially-distributed inter-arrival times. Let A0j be the time between the arrivals of the jth and (j+1)st calls. Then we assume that the probability that there are s or fewer minutes between the arrival of the jth call and the arrival of the (j+1)st call is P(A0j È s) = 1-e-as, where a is, say, 1 minute.
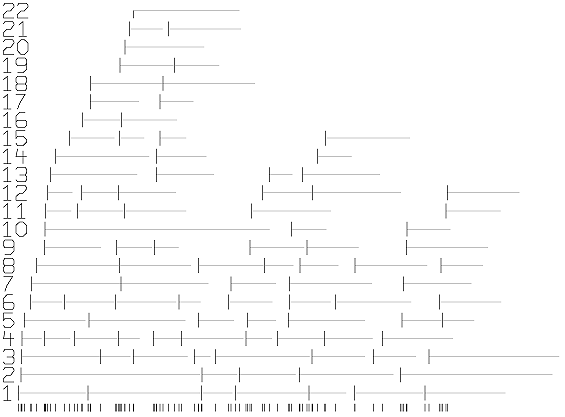
It is of interest to simulate this process and to graph the simulated use of the various ports as follows. In the graph below, the time of arrival of calls are marked on the t-axis, and each use of port i is shown by a solid line, starting at the indicated time and extending for the duration of the call.
A graph of this form is determined by a list of triples, one for each arriving call; so that for call i, we have (ti, li, pi) where ti is the time at which call i arrives, li is the length of call i, and pi is the port to which call i is assigned. Then we need only draw the line segments (ti,pi) to (ti+li,pi) for i = 1, 2, ¥, and, of course, mark the t-axis at the points (ti, 0) to indicate the times at which the calls arrive.
Given data of this form, we can, for example, easily estimate the percentage of time port i is busy, or estimate the number of ports needed to service 95% of the incoming calls.
Let Aij denote the interarrival time, Aij, between the jth and (j+1)st calls assigned to port i; Aij is a random variable. An analysis of interest is to state the distribution of Aij in terms of i, j, and the distribution functions of the length and interarrival time of incoming calls. It often suffices to determine the limiting form for the distribution of Aij as jÛË.
In the case where the times of arrival of incoming calls forms a Poisson process as assumed above, we can explicitly state the desired distributions.
Let Dij be the non-busy waiting time between the end of the jth call on port i and the arrival of the next call assigned to port i. Let L ~ l1, so L is lognormally-distributed, as is l1. Note the inter-arrival time Aij ~ L+Dij for i ° 1, and also D1j ~ A0j.
Let Di=limjÛËDij. Indeed Dij ~ Di for j > 1. Then, in the limit, port i is busy the fraction fi of the time, where fi = E(L/(L+Di)).
Now, when port i is free, an arriving call will be assigned to port i when ports 1, 2, ..., i-1 are all busy. So if a call arrives during an interval of time which satisfies this condition, it will be assigned to port i. Thus, in the limit, Di is the waiting time until the occurrence of the event that ports 1, 2, ..., i-1 are busy and a call arrives, and this can be interpreted as the waiting time until the next event of a Poisson process with density f1f2¥fi-1/a, where 1/a is the density of incoming calls. Thus Di is exponentially-distributed with mean a/(f1f2¥fi-1), for i > 1, and D1 ~ A0j.
Moreover, in the limit, the number of busy ports, N, at a fixed time is a Poisson random variable with mean u = E(L)/a; that is P(N = k) = uk e-u/k!.
Note this model is of interest where "calls'' are sessions with a time-sharing computer, people arriving for service at a system of queues which are scanned linearly, and other isomorphic situations. Let the vector (V1,V2,¥,Vn) denote the state of the n ports at the current time, t, so that Vi = 0 if port i is not busy, and Vi = the length of time remaining for the call using port i otherwise. Now, given that the next new call of length l arrives in s minutes from the current time t, we can update the state vector V to be valid at time t+s-e, where e is very small, by changing each Vi so that Vi ˜max(Vi-s,0). Then the state vector V is updated to be valid at time t+s+e by setting Vj to l, where j = X(V), and X(V) is the least index in {1,2,¥,n} such that VX(V) = 0. Let us denote the updating process used to make V the current state vector for time t+s-e, so that we may write V ˜ us(V) to denote updating V to time t+s-e.
Now our simulation can be programmed as follows. Note a total of d calls are simulated.
begin
t0 ˜ 0; j ˜ 1; V˜ 0; a:tj ˜ random-exponential+tj-1;
lj ˜ random-lognormal;
V ˜ utj-tj-1(V); pj ˜ X(V); Vpj ˜ lj; j ˜ j+1; if j È d then goto a;
end.
Upon completion, we have the three vectors, t, l, and p needed to draw
the required graph.
We may use the computer program MLAB to carry out the simulation sketched above and then draw the generated graph of port-usage over time. The MLAB system was originally developed at the National Institutes of Health and includes curve-fitting, differential equations, statistics and graphics as some of its major capabilities. MLAB is a tool for researchers in science and engineering. MLAB is a tool for solving continuous simulation and parameter-estimation problems such as chemical kinetics and compartmental models as well as discrete simulation problems such as we are considering here. A general do-file (script) to do the simulation and draw the graph of port-usage is given below, together with a sample graph generated by using it.
"calls.do"
type enter n: the number of calls";
n = kread();

type enter a random number seed";
r = kread(); r = ran(r);

type enter np: number of telephone ports";
np = kread();

v = 0^^np; "(np ports. Port i is busy for v[i] minutes)";

"generate t vector in order: partial sums of samples of an exponential
distribution with mean 1";
t = -(log on (ran on 0^^n));
t = 0 psum(t);

"generate l vector: lognormal with mean 10*exp(-(1/8)).";
l = normran on 0^^n; l = 10*(exp on .5*L);

"compute the p vector";
function pv(i) = if i > np then np else if v[i] = 0 then i else pv(i+1);
function u(w) = if w > s then w-s else 0;
p[n] = 0;
for j = 1:n do  \
   {i = minrow(v); if v[i] not= 0 then {np=np+1; i=np;};
   p[j] = i; v[i] = l[j];
   s = (if j = n then 0 else t[j+1])-t[j];
   v = u on v}

"given t, l, and p, draw the graph.";
m1 = t &'p; m2 = (t+l) &'p;
draw m1 line none pointtype vbar color red in w1
draw mesh(m1,m2) line alternate color green in w1
draw t '0 line none pointtype vbar in w1
draw 0 '(1:np) line none label 1:np offset (-.02,-.01) color yellow in w1
no imagebox in w1
view
Here is a graph of a simulation run with 100 calls produced by the above do-file.
This simulation can be run in a variety of forms. For example, we may assume that the mean of the exponential distribution for the inter-arrival times of incoming calls varies smoothly with the time of day, thus mimicking a heavier load during working hours, with peaks at, say, 10:00am and 3:00pm. This can be done by assuming the mean inter-arrival time, E(A0j), is an appropriate doubly-peaked function of time.