![[Previous Document]](http:/Images/Left.gif)
![[Back to CSI Home Page]](http:/Images/Home.gif)
![[Next Document]](http:/Images/Right.gif)
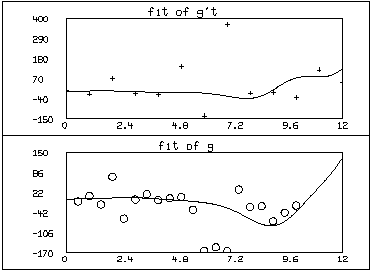
Here is an example which shows off each of the above features. Can you spot where each feature is exhibited?
 fct g't(t) = a*g(t-d) + h*root(z,-b,b, acos(z/b)-1/(t+1))
 fct h't(t)=cos(t-a)*g
 initial g(0)=c
 initial h(0)=1

 a=.1; b=1; c=.5; d=.1;
 m1= read(gdata,100,2)
 m2= read(gddata,100,2)

 fct wg(m,j)=abs(m[j,2]-sqrt(g))

 constraints q={a>0, b>1, .1<c, c<1}
 wr=ewt(m2)

 fitnorm=1
 fit(a,b,c,d),g to m1 with weight wg, g't to m2 with weight wr, constraints q
 final parameter values

     value           error           dependency     parameter
 8.326672685e-17  0.3825860609       0.983098032       A
 1.009375311      0.8904044698       0.9920220641      B
 1                7.341169978        0.9966718057      C
 0.5318706953     1.797693135e+308   1                 D
 2 iterations
 CONVERGED
 best weighted sum of squares = 9.072228e+04
 weighted root mean square error = 5.593169e+01
 weighted deviation fraction = 8.740915e-01
 lagrange multiplier[1] = -8986.559879
 lagrange multiplier[4] = 250.7190973

 draw m1 pt circle lt none
 draw points(g,0:12!160) color red
 top title "fit of g"
 frame 0 to 1, 0 to .5
 w1=w

 draw m2 pt "+" lt none
 draw points(g't,0:12!160) color green
 top title "fit of g''t"
 frame 0 to 1, .5 to 1
 view
![[Previous Document]](http:/Images/Left.gif)
![[Back to CSI Home Page]](http:/Images/Home.gif)
![[Next Document]](http:/Images/Right.gif)